secplot#
- CrossSections.secplot(secid='', val1='', val2='', val3='', **kwargs)#
Plots the geometry of a beam, pipe, shell, or reinforcing section to scale.
Mechanical APDL Command: SECPLOT
- Parameters:
- secid
str The section ID number (as defined via the sectype command).
- val1
str Values that control the information to be plotted. See the Notes section of this command description for more information. For clarity, the labels
VAL1,VAL2, andVAL3are renamed according to the section type.- val2
str Values that control the information to be plotted. See the Notes section of this command description for more information. For clarity, the labels
VAL1,VAL2, andVAL3are renamed according to the section type.- val3
str Values that control the information to be plotted. See the Notes section of this command description for more information. For clarity, the labels
VAL1,VAL2, andVAL3are renamed according to the section type.
- secid
Notes
secplot is valid for Beams and Pipes, SECPLOT_shells, and SECPLOT_reinf only. The command is not valid for
ELBOW290.secplot cannot display the plot of an ASEC (arbitrary section) subtype.
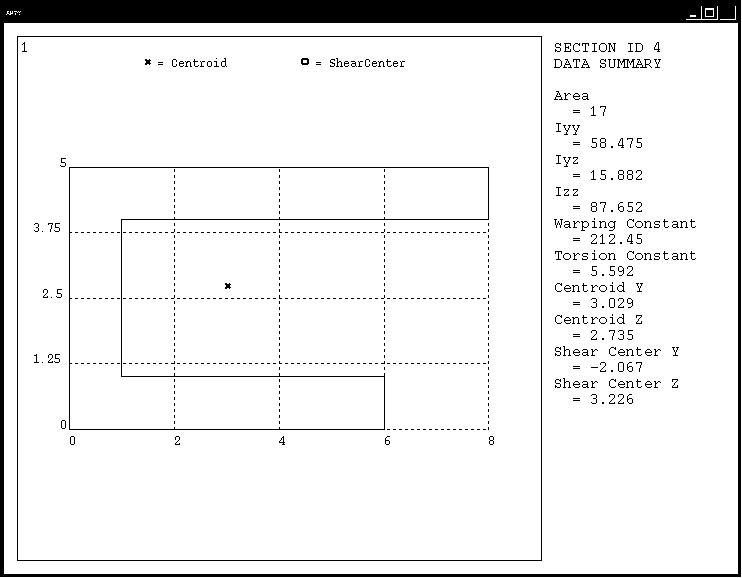
Plots the geometry of the beam or pipe section to scale depicting the centroid, shear center, and origin. secplot also lists various section properties such as
Iyy,Iyz, andIzz.Data to be supplied in the value fields:
MESHKEY- Beam or pipe section mesh display options:0- Display section outline only.1- Display beam or pipe section mesh.2- Display the section mesh with node numbers.3- Display the section mesh with cell numbers.4- Display the section mesh with material numbers and colors.5- Display the section mesh with material colors only.6- Display the section mesh with the RST node numbers. RST nodes are section corner nodes where results are available. This is applicable when the averaged results format (KEYOPT(15) = 0 forBEAM188,BEAM189,PIPE288, andPIPE289) is used.7- Display the section mesh with the RST cell numbers. RST cells are section cells where results are available. This is applicable when the non-averaged results format (KEYOPT(15) = 1 forBEAM188,BEAM189,PIPE288, andPIPE289) is used.
Options 2 through 6 do not depict centroid and shear center, nor do they list section properties.
Following is a sample section plot for the beam section type:
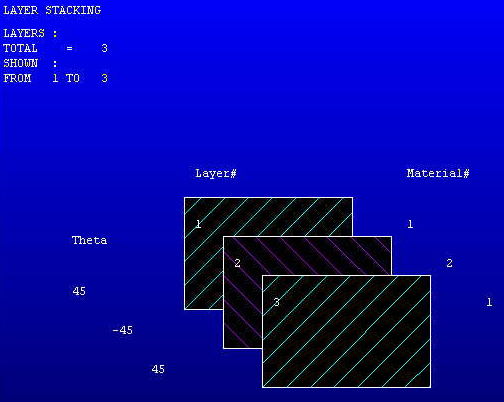
Plots the layer arrangement of the shell section showing the layer material and orientation.
Data to be supplied in the value fields:
LAYR1, LAYR2- The range of layer numbers to be displayed. IfLAYR1is greater thanLAYR2, a reversed order display is produced. Up to 20 layers may be displayed at the same time.LAYR1defaults to 1.LAYR2defaults toLAYR1ifLAYR1is input or to the number of layers (or to 19+LAYR1, if smaller) ifLAYR1is not input.
Following is a sample section plot for the shell section type:
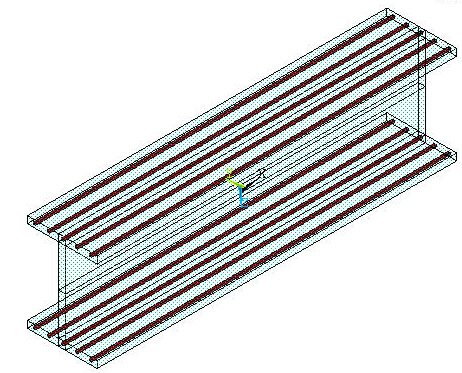
Plots the arrangement of a reinforcing section within the base element.
Data to be supplied in the value fields:
REINF1, REINF2, OVERLAY-REINF1, REINF2– The numerical range of reinforcings to be
- displayed. The default
REINF1 value is 1. The default
REINF2value is the number of reinforcings.OVERLAY– The section ID of the base element within which to display the reinforcing section. The section appears translucent and the reinforcing section is solid. Valid values are:SOLID – Display a translucent solid block over the reinforcing section
SECID– A number corresponding to a specific section ID of the base element.
If no
OVERLAYvalue is specified, the program displays the reinforcing section only.
Following is a sample section plot for the reinforcing section type:
For more information about reinforcing, see the documentation for the secdata command, and the
REINF264andREINF265elements.