Note
Go to the end to download the full example code.
Areas#
This example shows how to create basic geometry using area commands.
import numpy as np

from ansys.mapdl.core import launch_mapdl

# start MAPDL and enter the pre-processing routine
mapdl = launch_mapdl()
mapdl.clear()
mapdl.prep7()
print(mapdl)
Mapdl
-----
PyMAPDL Version:     0.73.2
Interface:           grpc
Product:             Ansys Mechanical Enterprise
MAPDL Version:       25.2
Running on:          localhost
                     (127.0.0.1)
APDL Command: A#
Create a simple triangle in the XY plane using three keypoints.
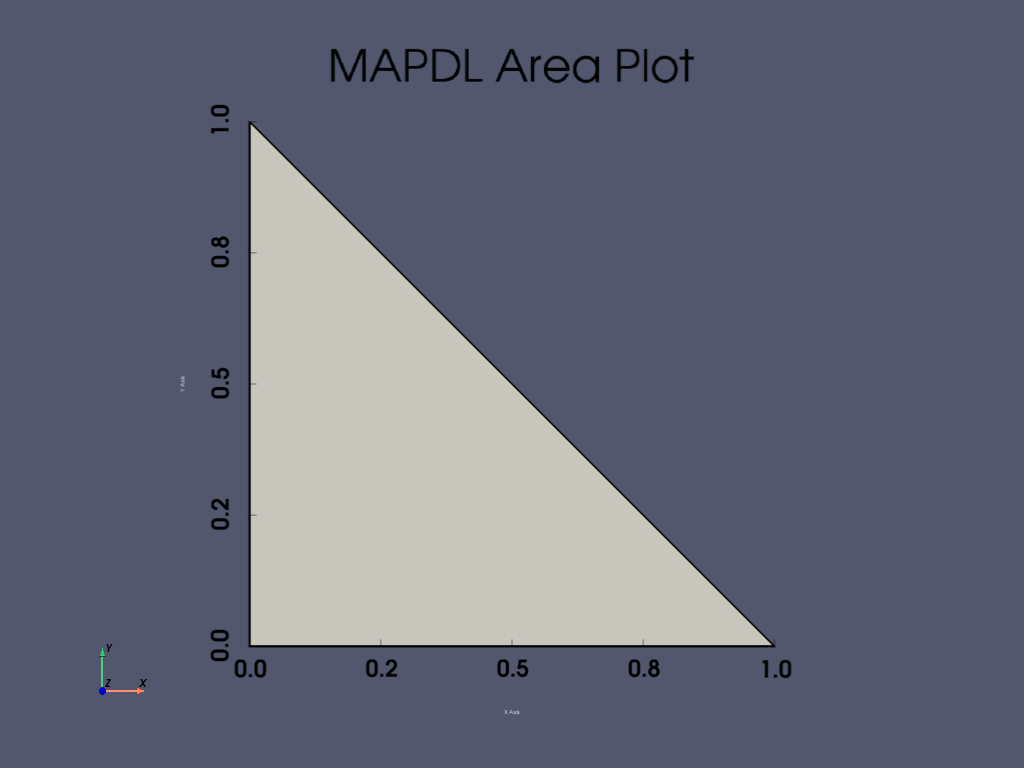
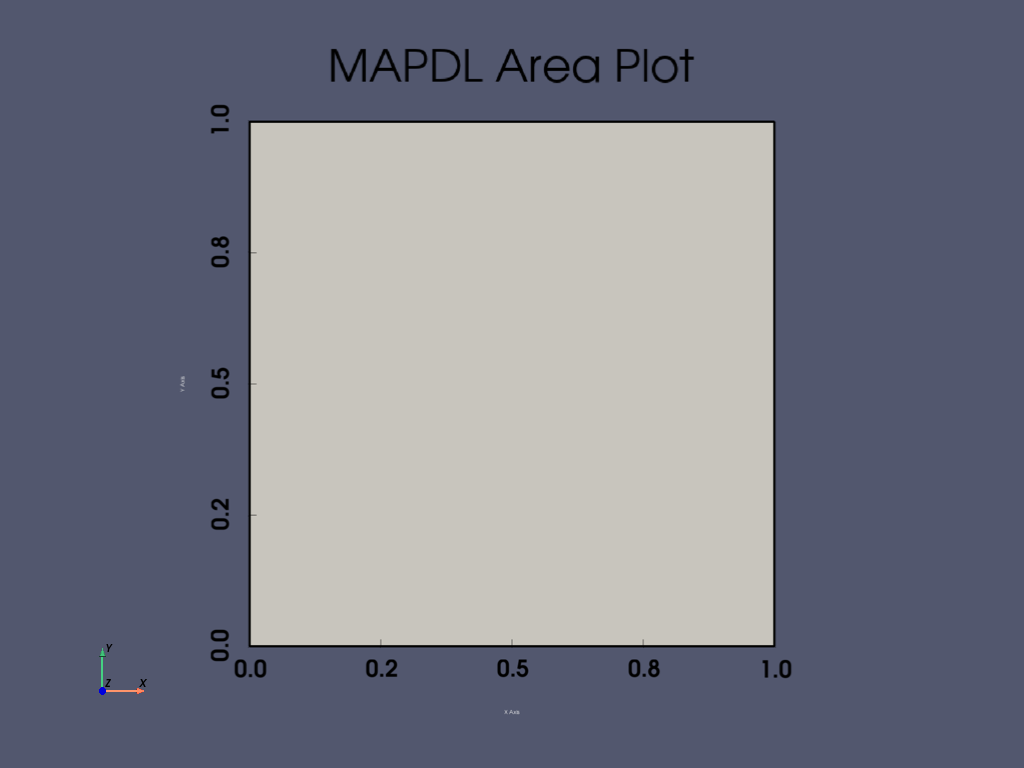
APDL Command: AL#
Create an area from four lines.
mapdl.clear()
mapdl.prep7()

k0 = mapdl.k("", 0, 0, 0)
k1 = mapdl.k("", 1, 0, 0)
k2 = mapdl.k("", 1, 1, 0)
k3 = mapdl.k("", 0, 1, 0)
l0 = mapdl.l(k0, k1)
l1 = mapdl.l(k1, k2)
l2 = mapdl.l(k2, k3)
l3 = mapdl.l(k3, k0)
anum = mapdl.al(l0, l1, l2, l3)
mapdl.aplot(show_lines=True, line_width=5, show_bounds=True, cpos="xy")
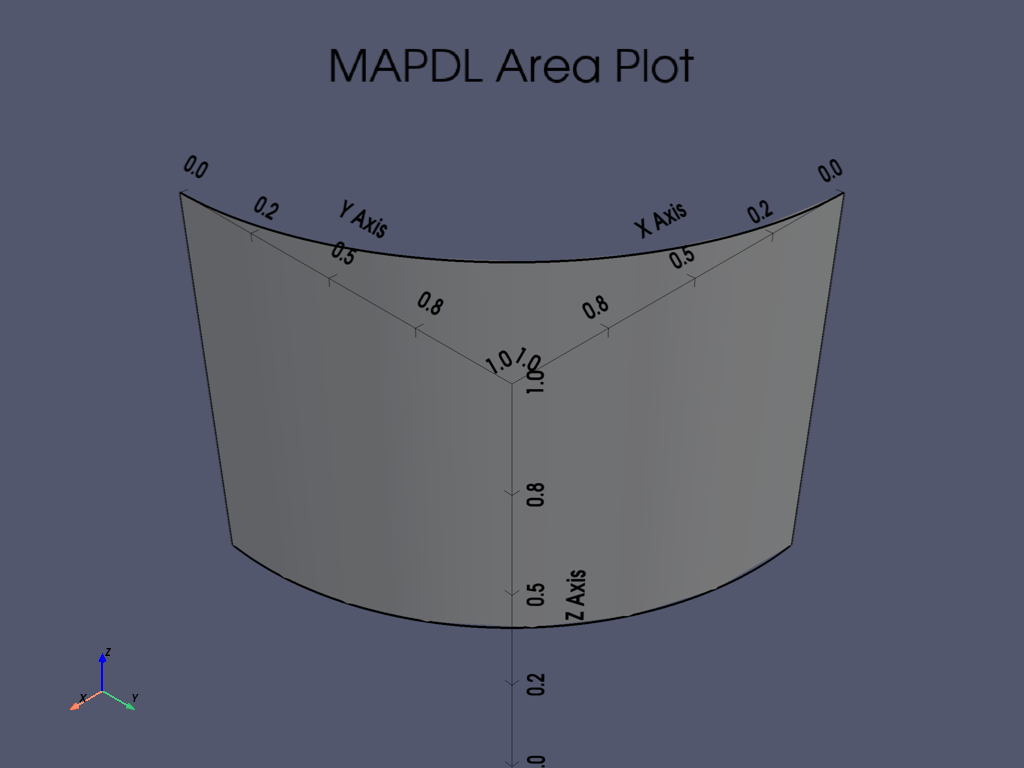
APDL Command: ADRAG#
Generate areas by dragging a line pattern along a path.
Drag a circle between two keypoints to create an area
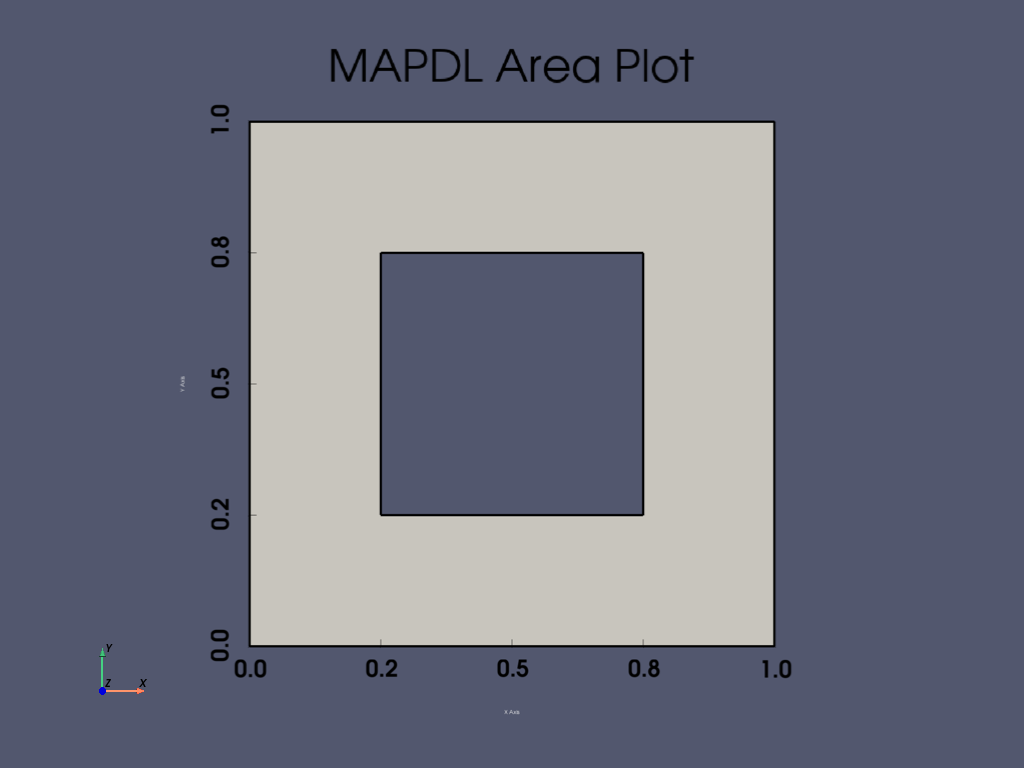
APDL Command: ASBA#
Subtract a 0.5 x 0.5 rectangle from a 1 x 1 rectangle.
Area IDs#
Return an array of the area IDs
array([3], dtype=int32)
Area Geometry#
Get the VTK Multiblock containing lines. This VTK mesh can be
saved or plotted. For more information, see the
PyVista documentation.
areas = mapdl.geometry.areas
areas
Merged Area Geometry#
You can also obtain the areas as pyvista.PolyData objects.
Note that this is a method. You can select the quality of the areas (mesh density) and whether you want a merged output or individual meshes.
Area Selection#
There are two approaches for selecting areas, the old “legacy” style and the new style. The old style is valuable for those who are comfortable with the existing MAPDL commands, and new style is useful for selecting areas in a pythonic manner.
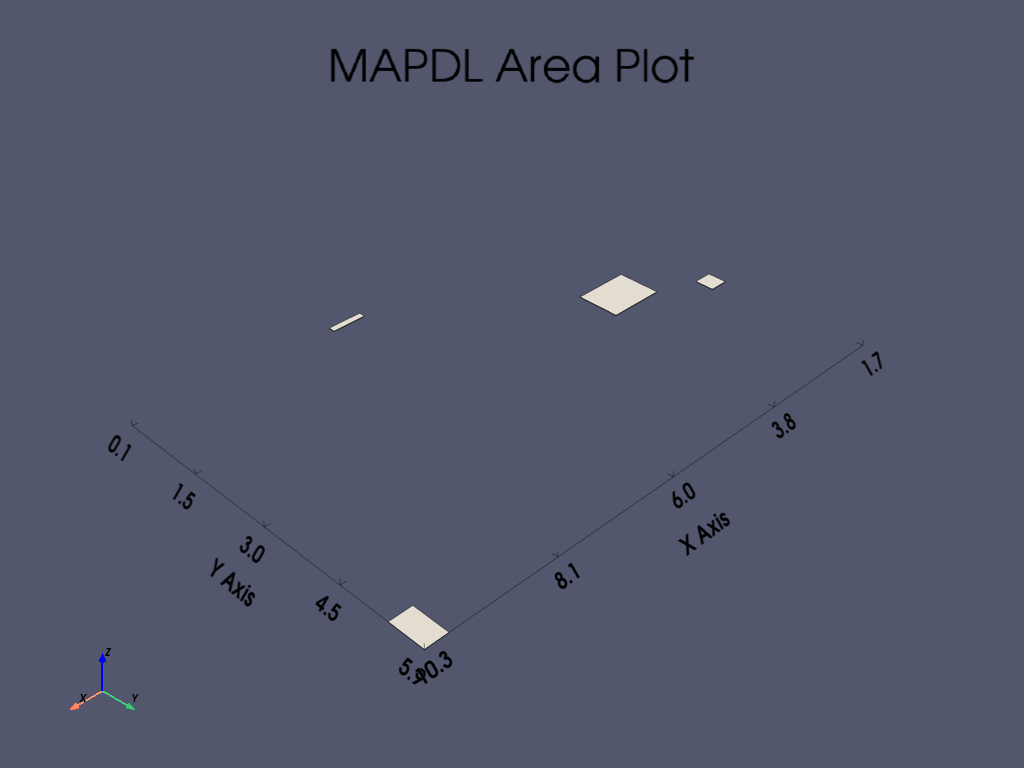
This example generates a series of random squares and selects them
mapdl.clear()
mapdl.prep7()


def generate_random_area():
    start_x, start_y, height, width = np.random.random(4)
    mapdl.blc4(start_x * 10, start_y * 10, height, width)


# create 20 random rectangles
for i in range(20):
    generate_random_area()

# Print the area numbers
print(mapdl.geometry.anum)
[ 1 2 3 4 5 6 7 8 9 10 11 12 13 14 15 16 17 18 19 20]
Select every other area with the old style command.
mapdl.asel("S", "AREA", "", 1, 20, 2)
print(mapdl.geometry.anum)
[ 1 3 5 7 9 11 13 15 17 19]
Select every other area with the new style command.
Note that the Area IDs are 1 based in MAPDL, while Python ranges are 0 based.
mapdl.geometry.area_select(range(1, 21, 2))
print(mapdl.geometry.anum)
[ 1 3 5 7 9 11 13 15 17 19]
Select areas from a list
Note that you can return_selected if you want to see what you
have selected. This is helpful when reselecting from existing
areas.
[ 1 5 10 20]
APDL Command: APLOT#
This method uses VTK and pyvista to generate a dynamic 3D plot.
There are a variety of plotting options available for all the common
plotting methods. Here, we enable the bounds and show the lines of
the plot while increasing the plot quality with the quality
parameter.
Note that the cpos keyword argument can be used to describe the camera direction from the following:
iso- Isometric viewxy- XY Plane viewxz- XZ Plane viewyx- YX Plane viewyz- YZ Plane viewzx- ZX Plane viewzy- ZY Plane view
mapdl.aplot(quality=1, show_bounds=True, cpos="iso", show_lines=True)
Stop mapdl#
mapdl.exit()
Total running time of the script: (0 minutes 3.813 seconds)