Interactive plotting#
When generating geometry from scratch within MAPDL, it is often
necessary to plot the geometry, such as key points, lines, areas,
and volumes. PyMAPDL supports plotting basic CAD using VTK. The
Mapdl class leverages the
existing MAPDL commands by providing the following functions, which
transfer the geometry to Python to visualize it:
These methods rely on the ansys.mapdl.core.plotting.visualizer.MapdlPlotter
method. Combined with the MAPDL geometry commands, you can
generate and visualize geometry from scratch without opening the GUI
using the open_gui() method.
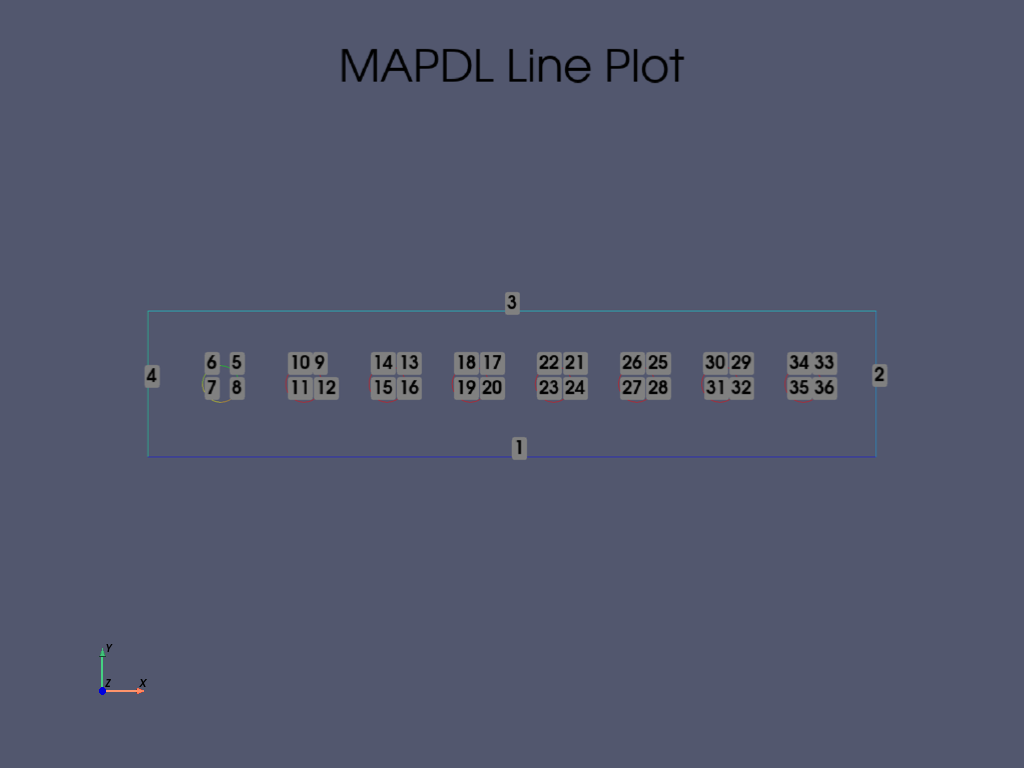
Line plotting#
You plot lines within Python using the Mapdl.lplot() method:
>>> from ansys.mapdl.core import launch_mapdl
>>> import numpy as np
>>> mapdl = launch_mapdl()

# Create a rectangle with a few holes
>>> mapdl.prep7()
>>> rect_anum = mapdl.blc4(width=1, height=0.2)

# Create several circles in the middle in the rectangle
>>> for x in np.linspace(0.1, 0.9, 8):
...     mapdl.cyl4(x, 0.1, 0.025)
...

# Generate a line plot
>>> mapdl.lplot(color_lines=True, cpos="xy")
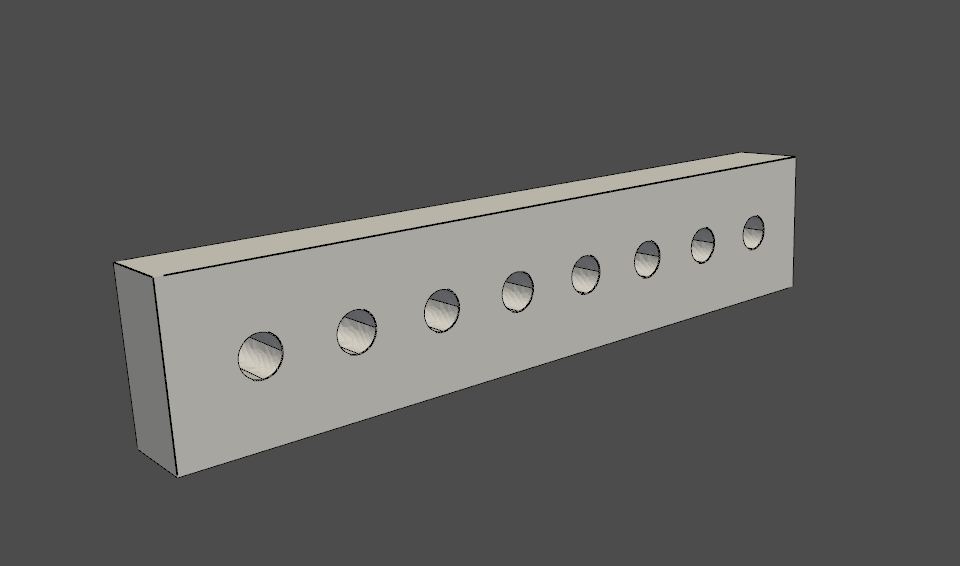
Area and volume plotting#
You can using Boolean operations to obtain more complex geometry and
visualize them using the Mapdl.vplot()
method. This example cuts the initial area with the eight circles and then
extrudes it.
>>> plate_holes = mapdl.asba(rect_anum, "all")

# Extrude this area
>>> mapdl.vext(plate_holes, dz=0.1)
>>> mapdl.vplot()
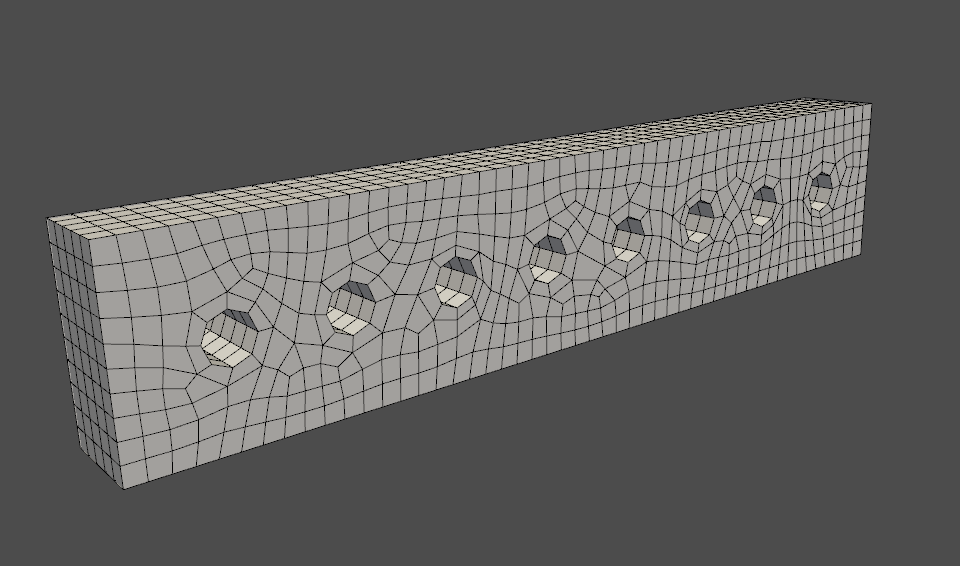
Node and element plotting#
You can plot nodes and elements directly from the instance of the
Mapdl class. This code defines
some element types, performs meshing, and then displays the mesh:
>>> mapdl.et(1, "SOLID186")
>>> mapdl.vsweep("ALL")
>>> mapdl.esize(0.1)
>>> mapdl.eplot()
Plotting non-interactively using MAPDL#
You can also plot using MAPDL’s native plotting tools. To use the
native tools, pass graphics_backend=GraphicsBackend.MAPDL when running plotting commands such
as the Mapdl.aplot and
Mapdl.eplot methods. Plots are
generated within MAPDL and then shown using
Matplotlib.
Start PyMAPDL
>>> from ansys.mapdl.core import launch_mapdl
>>> mapdl = launch_mapdl()
Create a square area using key points
>>> mapdl.prep7()
>>> mapdl.k(1, 0, 0, 0)
>>> mapdl.k(2, 1, 0, 0)
>>> mapdl.k(3, 1, 1, 0)
>>> mapdl.k(4, 0, 1, 0)
>>> mapdl.l(1, 2)
>>> mapdl.l(2, 3)
>>> mapdl.l(3, 4)
>>> mapdl.l(4, 1)
>>> mapdl.al(1, 2, 3, 4)
Set the view to “isometric”
>>> mapdl.view(1, 1, 1, 1)
>>> mapdl.pnum("kp", 1)  # enable keypoint numbering
>>> mapdl.pnum("line", 1)  # enable line numbering
Each of these creates a Matplotlib figure and pause execution.
>>> from ansys.mapdl.core.plotting import GraphicsBackend
>>> mapdl.aplot(graphics_backend=GraphicsBackend.MAPDL)
>>> mapdl.lplot(graphics_backend=GraphicsBackend.MAPDL)
>>> mapdl.kplot(graphics_backend=GraphicsBackend.MAPDL)
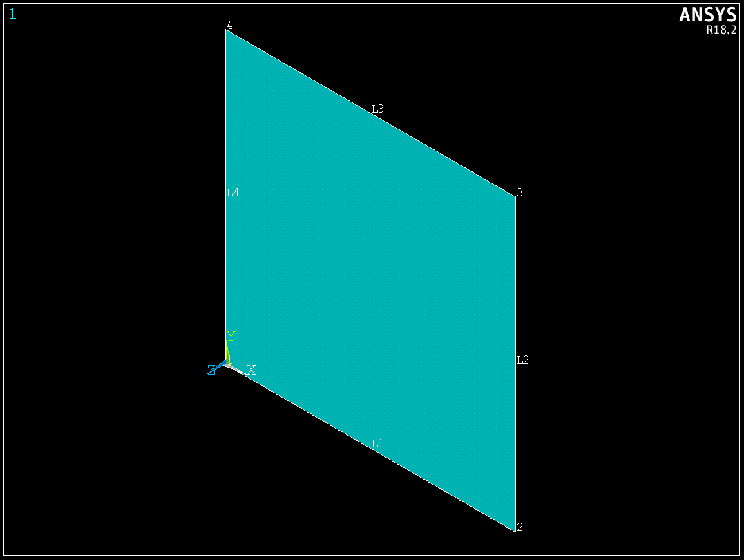
Area Plot from MAPDL displayed using Matplotlib#
For more information on plotting functions, see Plotting.
Plotting keyword options#
When graphics_backend=GraphicsBackend.PYVISTA, which is the default, all MAPDL plotting
methods allow you to enter in additional keyword arguments to better
control the plot. For example, you can automatically generate a
screenshot of an area plot or element plot with this code:
>>> mapdl.aplot(savefig="aplot.png")
>>> mapdl.eplot(savefig="eplot.png")
You can also control the camera position with cpos when you
want to view from a standard viewing direction. This code shows how
to view the XY plane with cpos='xy'.
>>> mapdl.eplot(cpos="xy")
For all general plotting options, see the
ansys.mapdl.core.plotting.visualizer.MapdlPlotter class.
Plotting boundary conditions#
Warning
This feature is beta so its functionalities and stability are limited. See the documentation regarding the allowed boundary conditions and targets.
It is possible to plot the boundary conditions applied on the model by
specifying plot_bc=True in plotting functions. For example, this code
specifies plot_bc=True for the Mapdl.nplot()
method:
>>> mapdl.nplot(
...     plot_bc=True, plot_labels=True, savefig=f"bc_plot.png", bc_labels="mechanical"
... )
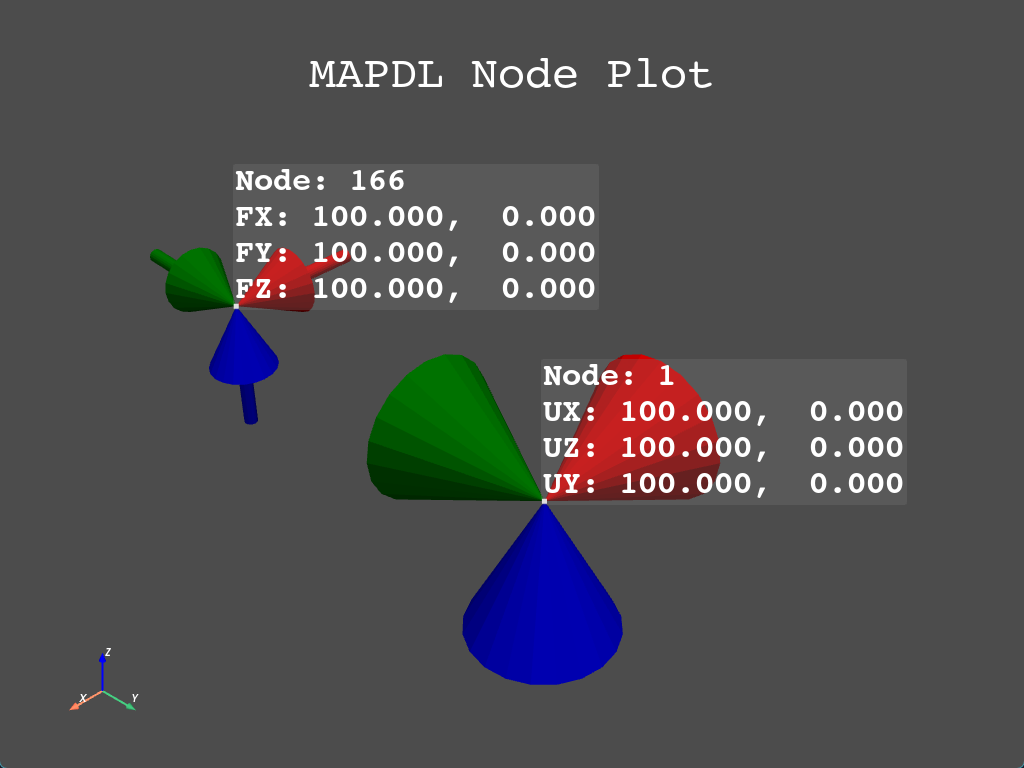
Mechanical boundary conditions Forces (arrows) and displacements (cones)#
Note
Because boundary conditions can only target nodes, you can
only use plot_bc as an argument in the
Mapdl.nplot() method.
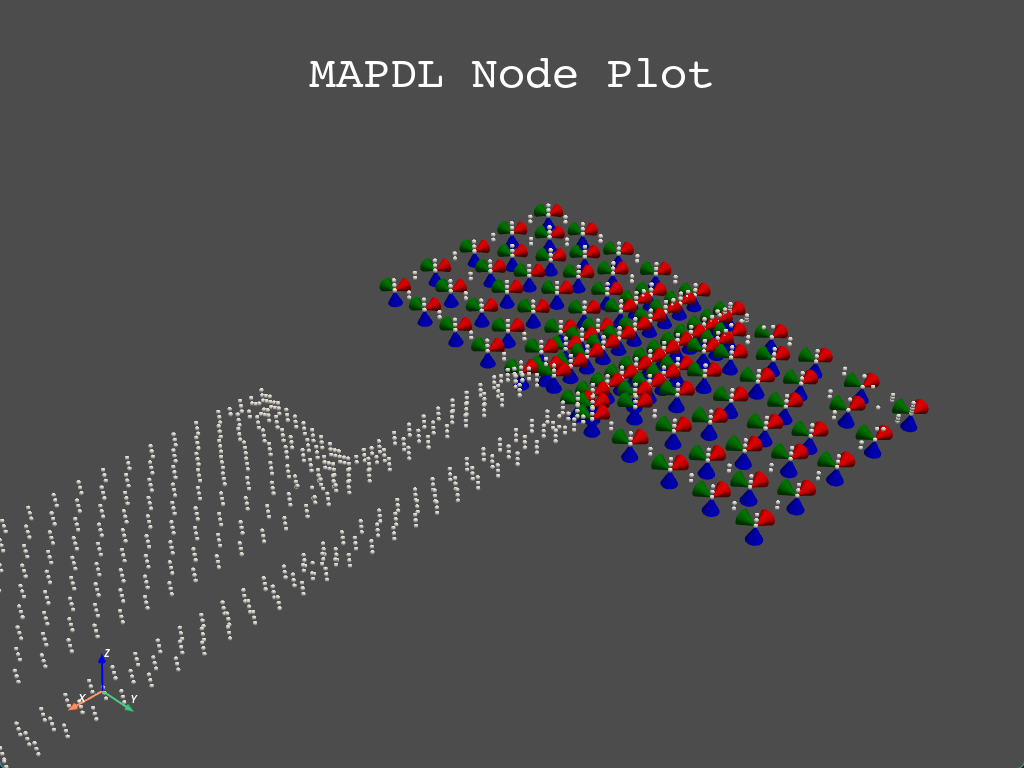
Boundary conditions demonstration#